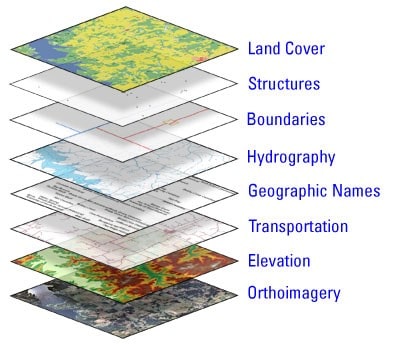
Geospatial analytics with Big Data has revolutionized the way businesses and organizations harness location-based data to gain valuable insights and make informed decisions. In the realm of Big Data, geospatial analytics involves the processing and analysis of vast quantities of spatial and location data to extract meaningful patterns, trends, and relationships. By leveraging advanced technologies and algorithms, organizations can unlock the potential of geospatial data to optimize operations, drive efficiencies, and create competitive advantages. This article will explore the fundamentals of performing geospatial analytics with Big Data, highlighting key considerations and best practices for effectively harnessing spatial data in the age of information overload and digital transformation.
Understanding Geospatial Analytics
Geospatial analytics involves the use of various analytical methods to analyze the spatial and geographic aspects of data. In a world increasingly driven by data, performing geospatial analytics with big data enables businesses to unlock valuable insights from location-based information. This type of analysis can help organizations to understand patterns, make informed decisions, and drive strategic initiatives based on geographical trends.
The Importance of Geospatial Analytics in Big Data
The integration of big data with geospatial analytics leads to more profound insights across various sectors, including urban planning, transportation, environmental monitoring, and marketing. Here are some key benefits:
- Enhanced Decision Making: Businesses can visualize their data spatially, allowing for real-time decision-making.
- Identifying Trends: By analyzing spatial patterns, organizations can predict future trends based on historical data.
- Resource Optimization: Geospatial analytics helps optimize resources and reduce waste by identifying the most effective locations for operations.
Key Components of Geospatial Analytics
To effectively perform geospatial analytics, you must understand its core components.
1. Geographic Information Systems (GIS)
Geographic Information Systems (GIS) are pivotal in managing, analyzing, and visualizing spatial data. GIS allows analysts to correlate various data layers, enabling them to understand relationships and patterns within the data.
2. Spatial Data
Spatial data represents the physical location and shape of objects. It can be divided into two categories:
- Vector Data: Represents discrete features and is made up of points, lines, and polygons.
- Raster Data: Represents continuous data in grid format, such as imagery from satellites or aerial photography.
3. Spatial Analysis Techniques
Various spatial analysis techniques can be applied, such as:
- Overlay Analysis: Combining different spatial datasets to identify relationships.
- Buffer Analysis: Creating zones around features to analyze proximity.
- Spatial Interpolation: Estimating values at unknown points based on known values from surrounding locations.
Steps to Perform Geospatial Analytics Using Big Data
Here are the essential steps to perform geospatial analytics effectively:
1. Data Collection
Begin by gathering relevant data from various sources. This may include:
- Public Datasets: Government and open-source data related to geography.
- Sensor Data: IoT devices and satellites that collect environmental data.
- Social Media Data: Geotagged information from platforms like Twitter and Instagram.
2. Data Processing
Next, process the collected data to clean, transform, and prepare it for analysis. This step often involves:
- Data Cleansing: Removing duplicates and correcting errors.
- Data Integration: Combining various datasets into a single platform.
- Data Transformation: Converting the data into a format suitable for GIS tools.
3. Data Analysis
Utilize different analytical methods to derive insights from the processed data. Common tools for data analysis in geospatial contexts include:
- ArcGIS: A popular GIS software for complex spatial analysis.
- QGIS: An open-source alternative to ArcGIS that supports extensive geospatial data manipulation.
- Apache Spark: A big data processing framework capable of handling large spatial datasets.
4. Data Visualization
Visualizing the results can make complex geospatial data more understandable. Use charts, maps, and other graphical representations to share your findings effectively. Techniques include:
- Thematic Mapping: Displaying data based on specific themes or categories.
- Heat Maps: Representing data density visually across a geographical area.
- Interactive Maps: Tools like Leaflet or Google Maps API can create user-friendly interfaces for exploring data.
5. Interpretation and Reporting
Finally, interpret the insights derived from your analysis and compile a report. Effective communication of your findings to stakeholders is crucial. Ensure that your report includes:
- Clear Visuals: Use charts and maps to illustrate key discoveries.
- Actionable Insights: Provide recommendations based on the analysis.
- Contextual Information: Explain the relevance of your findings in a broader context.
Tools and Technologies for Geospatial Analytics in Big Data
There are a range of tools and technologies available for performing geospatial analytics:
1. Big Data Platforms
Technologies such as Apache Hadoop and Apache Spark are essential for processing and analyzing large datasets that include geospatial information.
2. GIS Software
Besides ArcGIS and QGIS, other tools include:
- MapInfo: A powerful GIS tool for integrating spatial data with business intelligence.
- Carto: Cloud-based GIS platform that simplifies the visualization of geospatial data.
3. Programming Languages
Many data scientists use programming languages that support geospatial libraries, such as:
- Python: Libraries like GeoPandas and Folium make handling geospatial data easier.
- R: Packages such as sf and ggmap are important for spatial analysis in R.
Best Practices for Geospatial Analytics in Big Data
To enhance the effectiveness of your geospatial analytics:
- Data Quality: Ensure your data sources are reliable and consistent.
- Choose the Right Tools: Use appropriate tools for the specific needs of your analysis.
- Continuous Learning: Stay updated with the latest advancements in GIS and big data technologies.
Case Studies of Geospatial Analytics in Big Data
To illustrate the practical applications of geospatial analytics:
1. Urban Planning
City planners use geospatial analytics to visualize demographic data, assess public transportation efficiency, and plan new infrastructure by overlaying population density on available transport routes.
2. Environmental Monitoring
Organizations like NASA utilize satellite imagery and geospatial analytics to monitor climate change and its effects, creating environmental models that help predict future scenarios.
3. Marketing Analytics
Retailers analyze consumer behavior with geospatial data to identify prime locations for new stores based on foot traffic patterns and regional purchasing trends.
Leveraging geospatial analytics with Big Data holds immense potential in extracting valuable insights from vast and diverse datasets. By integrating location-based information with advanced analytics techniques, organizations can make informed decisions, optimize resources, and drive innovation across various industries. The combination of Big Data and geospatial analytics offers a powerful tool for unlocking new opportunities and improving overall business performance in today’s data-driven world.
Related posts:
 The Five Vs of Big Data: Volume, Velocity, Variety, Veracity, and Value
 Introduction to Distributed Computing in Big Data
 Understanding Data Pipelines in Big Data
 What is Apache Hadoop? A Complete Guide
 Understanding Apache Spark: Features and Use Cases
 Introduction to NoSQL Databases for Big Data
 Understanding HBase: How it Works in the Hadoop Ecosystem
 The Intersection of Big Data and Artificial Intelligence
 Natural Language Processing (NLP) with Big Data
 How Big Data is Used in Deep Learning Applications
 Sentiment Analysis with Big Data and AI
 Real-Time AI and Big Data: How It Works
 The Impact of Big Data on Financial Services and Banking
 Big Data in Smart Cities: Applications and Challenges