
Graph analytics is a powerful tool in the realm of Big Data, allowing organizations to uncover valuable insights hidden within complex network structures. Apache Giraph, an open-source graph processing framework, provides a scalable and efficient platform for performing graph analytics on large datasets. By leveraging Giraph’s parallel processing capabilities and fault-tolerant architecture, data scientists and analysts can efficiently analyze interconnected data points to extract meaningful patterns and relationships. In this article, we will explore how to effectively utilize Apache Giraph for graph analytics in the context of Big Data, showcasing its capabilities in processing and extracting valuable insights from massive graph data sets.
Understanding Apache Giraph
Apache Giraph is an iterative graph processing framework built on top of Apache Hadoop. It is designed to process large-scale graphs in a distributed manner, making it an excellent choice for big data analytics. Giraph leverages the bulk synchronous parallel (BSP) model, which allows developers to handle large datasets efficiently.
This framework is particularly useful for applications involving social networks, fraud detection, recommendation engines, and more, where relationships between entities are essential.
Environment Setup for Apache Giraph
Prerequisites
Before diving into graph analytics with Giraph, ensure you have the following ready:
- Apache Hadoop: Install a compatible version of Hadoop such as 2.7.x.
- Java Development Kit (JDK): Ensure JDK 7 or later is installed on your system.
- Apache Giraph: Download the latest version of Giraph from the [official Apache website](https://giraph.apache.org/).
Installation Steps
Follow these steps to install Apache Giraph:
- Download the latest Apache Giraph release from the official website.
- Unzip the downloaded file and navigate to the Giraph directory.
- Set environment variables by adding the following lines to your `~/.bashrc` or `~/.profile`:
- Source your profile to refresh the environment variables:
    export HADOOP_HOME=/path/to/hadoop
    export GIRAPH_HOME=/path/to/giraph
    export PATH=$PATH:$GIRAPH_HOME/bin:$HADOOP_HOME/bin
source ~/.bashrc
Creating a Graph in Apache Giraph
To analyze a graph, you first need to create it. Giraph supports creating graphs from various data formats. The most common are Adjacency List format and Edge List format.
Sample Dataset
Consider a simple graph with the following edges:
1   2
1   3
2   4
3   4
4   5
This can be represented in a text file called graph.txt where each line shows an edge between two vertices.
Loading the Graph
To load the graph, utilize the Giraph runner. The simplest invocation looks something like this:
bin/giraph.jar org.apache.giraph.GiraphRunner org.apache.giraph.examples.SimpleShortestPathsVertex -w 1 -vif org.apache.giraph.io.formats.JsonLongDoubleVertexInputFormat -vip graph.txt
This command runs the SimpleShortestPathsVertex algorithm, which finds the shortest path in graphs.
Performing Graph Analytics
Now that you have your graph loaded, it’s time to perform various graph analytics tasks.
Finding Shortest Paths
One of the fundamental operations in graph analytics is finding the shortest paths between nodes. The SimpleShortestPathsVertex class from Giraph can be used for this purpose. Here’s how to configure and run it:
bin/giraph.jar org.apache.giraph.GiraphRunner org.apache.giraph.examples.SimpleShortestPathsVertex -w 1 -vif org.apache.giraph.io.formats.JsonLongDoubleVertexInputFormat -vip graph.txt -e 1
This command executes the shortest paths algorithm, with `-e` denoting the ending vertex.
PageRank Algorithm
The PageRank algorithm is another crucial aspect of graph analytics, widely utilized in search engines. Giraph provides a built-in implementation of the PageRank algorithm.
To run the PageRank algorithm:
bin/giraph.jar org.apache.giraph.GiraphRunner org.apache.giraph.examples.PageRankVertex -w 3 -vif org.apache.giraph.io.formats.JsonLongDoubleVertexInputFormat -vip graph.txt
Adjusting the number of workers with the `-w` option allows faster processing depending on the size of your graph.
Custom Graph Algorithms
For specific analytics needs, you might want to create your custom graph algorithms. Here’s how to do it:
- Extend the Vertex class: Create a new class that extends `Vertex`. Override the necessary methods such as `compute()`, `initialize()`, and others based on your algorithm.
- Implement the Logic: Inside the `compute()` method, add the logic that your custom algorithm will execute on each vertex during each superstep.
- Compile and Run: Once your custom vertex class is complete, compile your program and run it in a similar way to the pre-built algorithms.
Optimizing Performance in Apache Giraph
To achieve optimal performance in graph analytics with Giraph, consider the following tips:
Partitioning Strategies
Effective partitioning of graph data can significantly reduce compute time. Vertices should be partitioned to minimize communication overhead, ensuring that frequently interacting vertices are co-located.
Tuning Memory Usage
Memory allocation is crucial in distributed graph processing. Adjust `giraph.memory.available` settings to ensure that there is enough memory available for processing large datasets.
Using Caching
Caching frequently accessed data or intermediate results within the computation can drastically enhance performance. Implement caching logic within your vertex computation to avoid redundant calculations.
Monitoring and Debugging
Monitoring jobs in Giraph is essential to ensure their success, especially with large datasets. Apache Giraph integrates well with Apache Hadoop’s YARN resource manager, which helps in tracking job health and resource usage.
Logging and Metrics
Utilize Apache Log4j for logging during the vertex computations. Setting appropriate log levels allows for capturing essential debugging information without overwhelming output.
Visualizing Graph Data
Consider using tools like GraphViz or Cytoscape for visualizing the graph data to help in understanding the data flows and the structure of the graph.
Resources and Community Support
Engaging with the community can provide additional insights and support. Some resources include:
- [Apache Giraph Official Documentation](https://giraph.apache.org/documentation.html)
- [Apache Hadoop Documentation](https://hadoop.apache.org/docs/stable/hadoop-project-dist/hadoop-common/Documentation/index.html)
- [Stack Overflow for troubleshooting](https://stackoverflow.com/questions/tagged/apach-giraph)
By tapping into these resources and implementing the strategies discussed, you can effectively perform powerful graph analytics with Apache Giraph, unlocking rich insights from your big data.
Apache Giraph provides a powerful platform for performing graph analytics in the realm of Big Data. By leveraging its distributed computing capabilities, users can unlock valuable insights from large-scale graph data efficiently and effectively. With its scalability, fault tolerance, and ease of use, Apache Giraph emerges as a versatile tool for handling complex graph-based analyses in the context of Big Data, making it a valuable asset for organizations seeking to extract meaningful information from interconnected data structures.
Related posts:
 What is Big Data? A Beginner’s Guide
 The Five Vs of Big Data: Volume, Velocity, Variety, Veracity, and Value
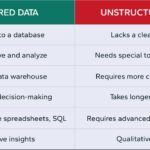 Structured vs. Unstructured Data: Key Differences and Examples
 The Role of Data Warehousing in Big Data
 What is a Data Lake? Definition, Uses, and Benefits
 Introduction to Distributed Computing in Big Data
 Big Data vs. Traditional Data: What’s the Difference?
 Understanding Data Pipelines in Big Data
 The Evolution of Big Data Technologies: Past, Present, and Future
 Data Ingestion Techniques for Big Data Processing
 What is Apache Hadoop? A Complete Guide
 Understanding Apache Spark: Features and Use Cases
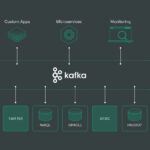 What is Kafka? How it Powers Real-Time Big Data Applications
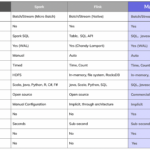 Apache Flink vs. Apache Spark: Which One is Better?