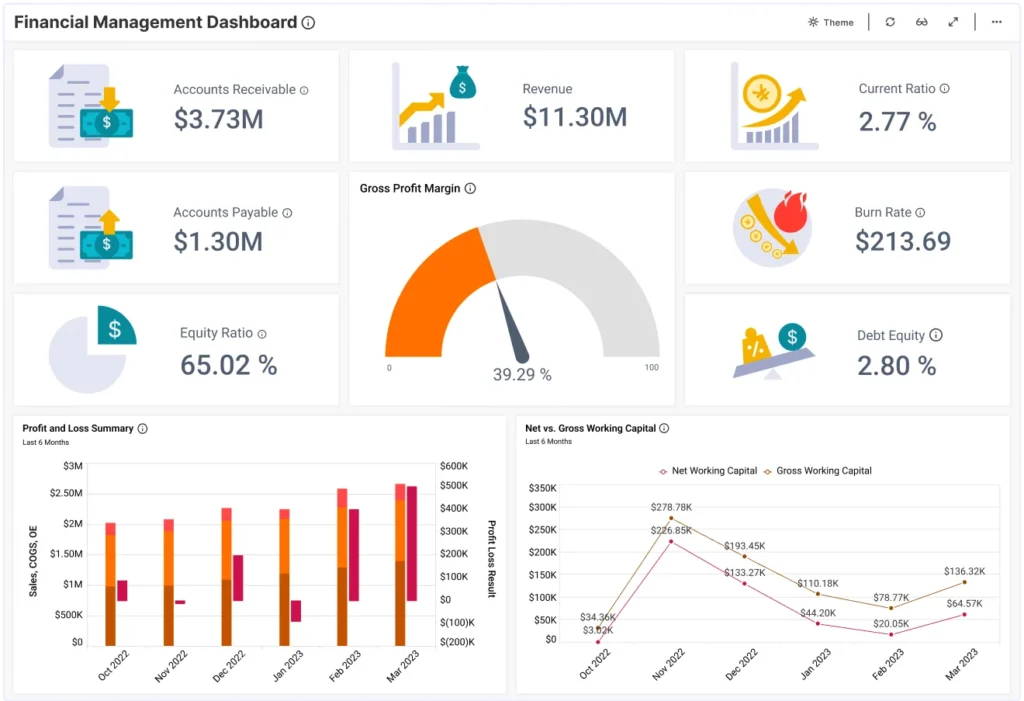
Financial Performance Dashboards for Executives are powerful tools that provide a clear and concise overview of an organization’s financial health and performance metrics. These dashboards consolidate complex financial data into easy-to-read visual representations, allowing executives to quickly assess key performance indicators, track trends, and make informed decisions. By offering real-time insights into revenue, expenses, profitability, and other critical financial metrics, these dashboards enable executives to stay informed, identify areas for improvement, and drive strategic decision-making to enhance overall financial performance.
In today’s fast-paced business environment, financial performance dashboards have become essential tools for executives. These powerful analytics tools allow leaders to visualize key financial metrics, make informed decisions, and drive company growth. This article explores the significance, components, and benefits of using financial performance dashboards in executive decision-making.
What is a Financial Performance Dashboard?
A financial performance dashboard is a visual representation of an organization’s financial data. It consolidates critical financial metrics into an interactive format that is easy to understand at a glance. Executives can monitor key performance indicators (KPIs) such as revenue, profit margins, cash flow, and budgetary performance, all from a single platform. The dashboard enables real-time data tracking and helps executives respond swiftly to changes in financial performance.
Key Components of Financial Performance Dashboards
A well-designed financial performance dashboard should incorporate various components to provide comprehensive insights. Here are the essential elements:
- Key Performance Indicators (KPIs): KPIs are the core metrics that reflect the organization’s financial health. Common KPIs include net profit margin, operating income, and return on investment (ROI).
- Visualizations: Effective dashboards utilize graphs, charts, and tables to present data clearly. Bar charts and pie charts help visualize revenue distribution or cost breakdowns.
- Customizable Views: Executives often have varying needs. A good dashboard allows users to customize their views, focusing on metrics that matter most to them.
- Real-Time Data Integration: Connecting the dashboard to real-time data feeds enables timely updates, ensuring executives have access to the latest information.
- Alerts and Notifications: Setting up alerts for significant changes in KPIs helps executives stay proactive in their decision-making process.
Benefits of Financial Performance Dashboards for Executives
Implementing a financial performance dashboard has numerous advantages for executives:
Enhanced Decision-Making
With immediate access to vital financial data, executives can make informed decisions quickly. Analyzing trends and patterns becomes more straightforward, leading to data-driven decisions that positively impact the organization.
Improved Financial Visibility
The comprehensive overview provided by a financial performance dashboard enhances visibility into the overall financial status of the organization. Executives can drill down into specific areas, allowing them to identify strengths and weaknesses in their operations.
Increased Accountability
By using dashboards that are accessible across the organization, executives foster a culture of accountability. Teams can monitor their performance against set financial goals, leading to greater responsibility for financial outcomes.
Time Savings
Automating data collection and reporting through dashboards saves time. Executives can spend less time crunching numbers and more time strategizing for growth. This efficiency allows for quicker responses to changing market conditions.
Collaboration and Communication
A financial performance dashboard facilitates collaboration between different departments. When teams can access the same data, discussions about financial performance become more focused and aligned toward common goals.
Choosing the Right Financial Performance Dashboard Tool
When selecting a financial performance dashboard tool, executives should consider several factors:
- Usability: The dashboard should be user-friendly. Executives should be able to navigate and extract insights effortlessly.
- Integration: The tool must integrate seamlessly with existing financial systems and data sources, such as ERP or CRM software.
- Customization: A good dashboard allows customization for different users, enabling executives to tailor metrics and visualizations to their specific needs.
- Cost: Analyze the pricing structure. Some tools may require high initial investments, while others operate on subscription models. Choose a solution that fits your budget while providing necessary features.
- Support and Training: Ensure that the vendor offers adequate support and training. A well-informed team can make the most of the dashboard’s functionality.
Implementing Financial Performance Dashboards in Your Organization
To successfully implement a financial performance dashboard in your organization, follow these steps:
1. Identify Key Metrics
Work with stakeholders to identify the KPI that aligns with organizational goals. Determine what data points are most critical for effective decision-making.
2. Choose the Right Software
After evaluating various dashboard solutions, select one that meets your needs for functionality, usability, and integration.
3. Involve Stakeholders
Get team buy-in by involving various stakeholders in the dashboard development process. Their input can enhance functionality and ensure that the tool serves its intended purpose.
4. Train Users
Provide thorough training sessions to ensure that all users understand how to navigate the dashboard and interpret the data correctly.
5. Monitor and Adjust
Once the dashboard is implemented, continually monitor its effectiveness. Collect feedback from users and make necessary adjustments to improve its functionality and usability.
Future Trends in Financial Performance Dashboards
The landscape of financial performance dashboards is continuously evolving. Here are some future trends to watch to ensure your organization stays competitive:
1. AI and Machine Learning Integration
As technology advances, more dashboards are likely to integrate AI and machine learning algorithms that can provide predictive analytics and deeper insights into financial trends.
2. Greater Accessibility
With the rise of remote work, dashboards will become more accessible across various devices. Cloud-based solutions will facilitate this trend, allowing executives to view data anytime, anywhere.
3. Enhanced Data Visualization
Dashboards will see improvements in data visualization techniques, making it easier for executives to understand complex data through intuitive and interactive designs.
4. Customization Features
Future tools will likely offer more sophisticated customization options, allowing executives to tailor their dashboard experience precisely to their needs.
5. Real-Time Collaboration
As collaboration becomes increasingly crucial, dashboards will evolve to allow for real-time collaboration features, enabling teams to discuss insights and take action collaboratively.
In the dynamic world of business, equipped with the right financial tools, executives can significantly enhance their decision-making capabilities. A robust financial performance dashboard delivers invaluable insights, aligns teams towards common objectives, and positions organizations for sustainable growth.
Financial Performance Dashboards provide executives with a comprehensive and real-time overview of an organization’s financial health, enabling informed decision-making and strategic planning. By centralizing key financial data and presenting it in a visually appealing format, these dashboards empower executives to effectively monitor performance, identify trends, and drive business success.
Related posts:
 The SELECT Statement: How to Retrieve Data from a Table
 How to Use ORDER BY to Sort Query Results
 The DELETE Command: Removing Records from SQL Tables
 Understanding Primary Keys and Foreign Keys
 Common Data Types in SQL Explained
 Logical Operators: AND, OR, NOT
 The CASE Statement in SQL: Conditional Logic in Queries
 Date Functions: NOW(), DATEDIFF(), DATE_ADD(), and More
 Limiting Results with the LIMIT Clause
 What are Window Functions, and How Do They Work?
 Understanding ROW_NUMBER(), RANK(), and DENSE_RANK()
 PIVOT and UNPIVOT Explained with Examples
 Types of Indexes: Clustered vs. Non-Clustered
 Using EXPLAIN to Analyze SQL Queries