
The OpenWeather API provides a convenient way to access real-time air quality data for various locations around the world. By leveraging this API through APIs & Web Services, developers can easily integrate air quality monitoring functionality into their applications. This allows for the display of up-to-date air quality information, enabling users to make informed decisions about their outdoor activities and overall well-being. Through proper utilization of the OpenWeather API, developers can create innovative solutions that contribute to a healthier and more sustainable environment.
What is the OpenWeather API?
The OpenWeather API is a robust web service that provides comprehensive weather data, including real-time air quality indices. It enables developers to easily access global weather and air quality information through various endpoints, making it an essential tool for applications focused on environmental monitoring and health.
Getting Started with OpenWeather API
To get started with the OpenWeather API for air quality monitoring, you will need to:
- Create an Account: Sign up for an account on the OpenWeather website.
- Obtain an API Key: After signing up, you will receive an API key that you will use to authenticate your requests.
Understanding Air Quality Data
OpenWeather provides data that includes the AQI (Air Quality Index), which indicates the level of air pollution in terms of various pollutants. Here are some critical pollutants that the API covers:
- PM2.5: Particulate matter less than 2.5 micrometers.
- PM10: Particulate matter less than 10 micrometers.
- NO2: Nitrogen Dioxide.
- O3: Ozone.
- SO2: Sulfur Dioxide.
- CO: Carbon Monoxide.
Making Your First API Call
To access air quality data via the OpenWeather API, you will use the following endpoint:
https://api.openweathermap.org/data/2.5/air_pollution?lat={lat}&lon={lon}&appid={API_KEY}In this URL, replace {lat} and {lon} with the geographical coordinates of the location you want to monitor, and {API_KEY} with your actual API key.
Example: Fetching Air Quality Data
Here’s a simple example using JavaScript with the Fetch API to get real-time air quality data for a specific location, say London (51.5074° N, 0.1278° W):
const apiKey = 'YOUR_API_KEY';
const latitude = 51.5074;
const longitude = -0.1278;
const url = `https://api.openweathermap.org/data/2.5/air_pollution?lat=${latitude}&lon=${longitude}&appid=${apiKey}`;

fetch(url)
    .then(response => response.json())
    .then(data => console.log(data))
    .catch(error => console.error('Error:', error));
Interpreting the API Response
After making the API call, you will receive a JSON response containing various pieces of information. Here’s an example of what the structure may look like:
{
    "coord": {
        "lon": -0.1278,
        "lat": 51.5074
    },
    "list": [
        {
            "main": {
                "aqi": 1
            },
            "components": {
                "co": 210.76,
                "no": 0.4,
                "no2": 8.51,
                "o3": 17.96,
                "so2": 0.24,
                "pm2_5": 1.53,
                "pm10": 1.81,
                "nh3": 0.42
            },
            "dt": 1605187059
        }
    ]
}
The response includes:
- aqi: The Air Quality Index categorizing the air quality from 1 (good) to 5 (very poor).
- components: Concentrations of major pollutants in micrograms per cubic meter (µg/m³), such as CO, NO, NO2, O3, SO2, PM2.5, PM10, and NH3.
Visualizing Air Quality Data
Visualizing air quality data can significantly improve user understanding. You can use libraries such as Chart.js, D3.js, or Google Charts to create compelling charts that represent this data visually. Below is a basic example of how to create a bar chart using Chart.js:
const ctx = document.getElementById('airQualityChart').getContext('2d');
const airQualityChart = new Chart(ctx, {
    type: 'bar',
    data: {
        labels: ['CO', 'NO2', 'O3', 'SO2', 'PM2.5', 'PM10'],
        datasets: [{
            label: 'Pollutant Concentration (µg/m³)',
            data: [data.list[0].components.co, data.list[0].components.no2, data.list[0].components.o3, data.list[0].components.so2, data.list[0].components.pm2_5, data.list[0].components.pm10],
            backgroundColor: ['rgba(75, 192, 192, 0.2)', 'rgba(255, 99, 132, 0.2)', 'rgba(54, 162, 235, 0.2)', 'rgba(255, 206, 86, 0.2)', 'rgba(153, 102, 255, 0.2)', 'rgba(255, 159, 64, 0.2)'],
            borderColor: ['rgba(75, 192, 192, 1)', 'rgba(255, 99, 132, 1)', 'rgba(54, 162, 235, 1)', 'rgba(255, 206, 86, 1)', 'rgba(153, 102, 255, 1)', 'rgba(255, 159, 64, 1)'],
            borderWidth: 1
        }]
    },
    options: {
        scales: {
            y: {
                beginAtZero: true
            }
        }
    }
});
Handling Errors in API Calls
When working with any API, it’s crucial to handle errors appropriately. Common errors may include:
- Invalid API Key: Check whether your API key is correctly provided.
- Exceeded Quota: Ensure you’re within the allowed limits for API calls.
- Bad Request: Verify the parameters you are passing in your request.
Here’s how to improve error handling in your fetch request:
fetch(url)
    .then(response => {
        if (!response.ok) {
            throw new Error('Network response was not ok ' + response.statusText);
        }
        return response.json();
    })
    .then(data => console.log(data))
    .catch(error => console.error('Fetch error:', error));
Integrating OpenWeather API with Other Services
The OpenWeather API can be seamlessly integrated with other services to expand its functionality. For example, combining the API with a notification service can automatically alert users about poor air quality conditions. You may consider using platforms like IFTTT or Zapier.
Example of Integration
You can use Twilio’s SMS service to send alerts. Here’s a general flow:
- Fetch air quality data using the OpenWeather API.
- Check if the AQI exceeds a set threshold.
- If it does, send a message using Twilio’s API.
Best Practices for Using OpenWeather API
To ensure your application is efficient and user-friendly, follow these best practices:
- Cache Results: Store previous results to reduce unnecessary API calls.
- Respect Rate Limits: Be mindful of your API call limits to avoid being blocked.
- Use HTTPS: Ensure all API calls are made over HTTPS for security.
- Document Your Code: Provide clear documentation for your API calls and their parameters.
Conclusion: Monitoring Air Quality Effectively
Using the OpenWeather API for real-time air quality monitoring can significantly empower both developers and users to stay informed about their environment. By combining data retrieval, visualization, error handling, and integration with external services, you can create powerful applications that contribute to public health and awareness.
Utilizing the OpenWeather API for real-time air quality monitoring through APIs and web services offers a valuable tool for accessing up-to-date environmental data. By integrating this API into applications and platforms, users can efficiently gather and display air quality information, enabling informed decision-making and promoting public health awareness. The OpenWeather API provides a reliable means of accessing this crucial data, making it a valuable resource for developers and organizations looking to enhance their environmental monitoring capabilities.
Related posts:
 How to Integrate the Telegram Bot API for Automated Messaging
 How to Implement an API Gateway for Serverless Applications
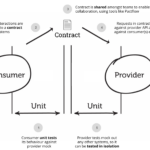 What Is an API Consumer-Driven Contract and How to Use It?
 The Benefits of Using Server-Sent Events (SSE) in APIs
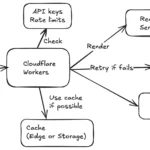 How to Use Cloudflare Workers to Optimize API Performance
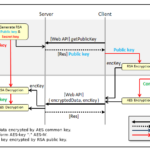 How to Implement API Data Encryption with AES
 How to Implement API WebSockets with NestJS
 The Difference Between API SDKs and API Wrappers
 How to Implement API Response Caching with Varnish
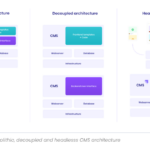 How to Build a Headless CMS API with Strapi
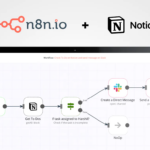 How to Use the Notion API for Task Management Automation
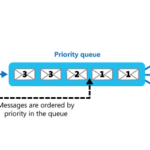 How to Implement API Request Prioritization with Queues
 How to Implement API Connection Pooling for Database Efficiency
 How to Implement Dynamic API Routing for Multi-Tenant Applications